The Census Database
From handwritten cards to a database available online and worldwide: in the 75-year history of the Census, the project has developed on numerous platforms, supported by different institutions in different locations. In the late 1970s, the first suggestion was made that the index cards in the Census files, which were already considerable in number, should be transferred to a computer system using the latest technology. Thus the oldest art historical computer database was born. New data is still being added to it and it can be used by art historians and archaeologists around the world.
Below is a timeline outlining the major milestones in the development of the digital census from the 1980s to the present.
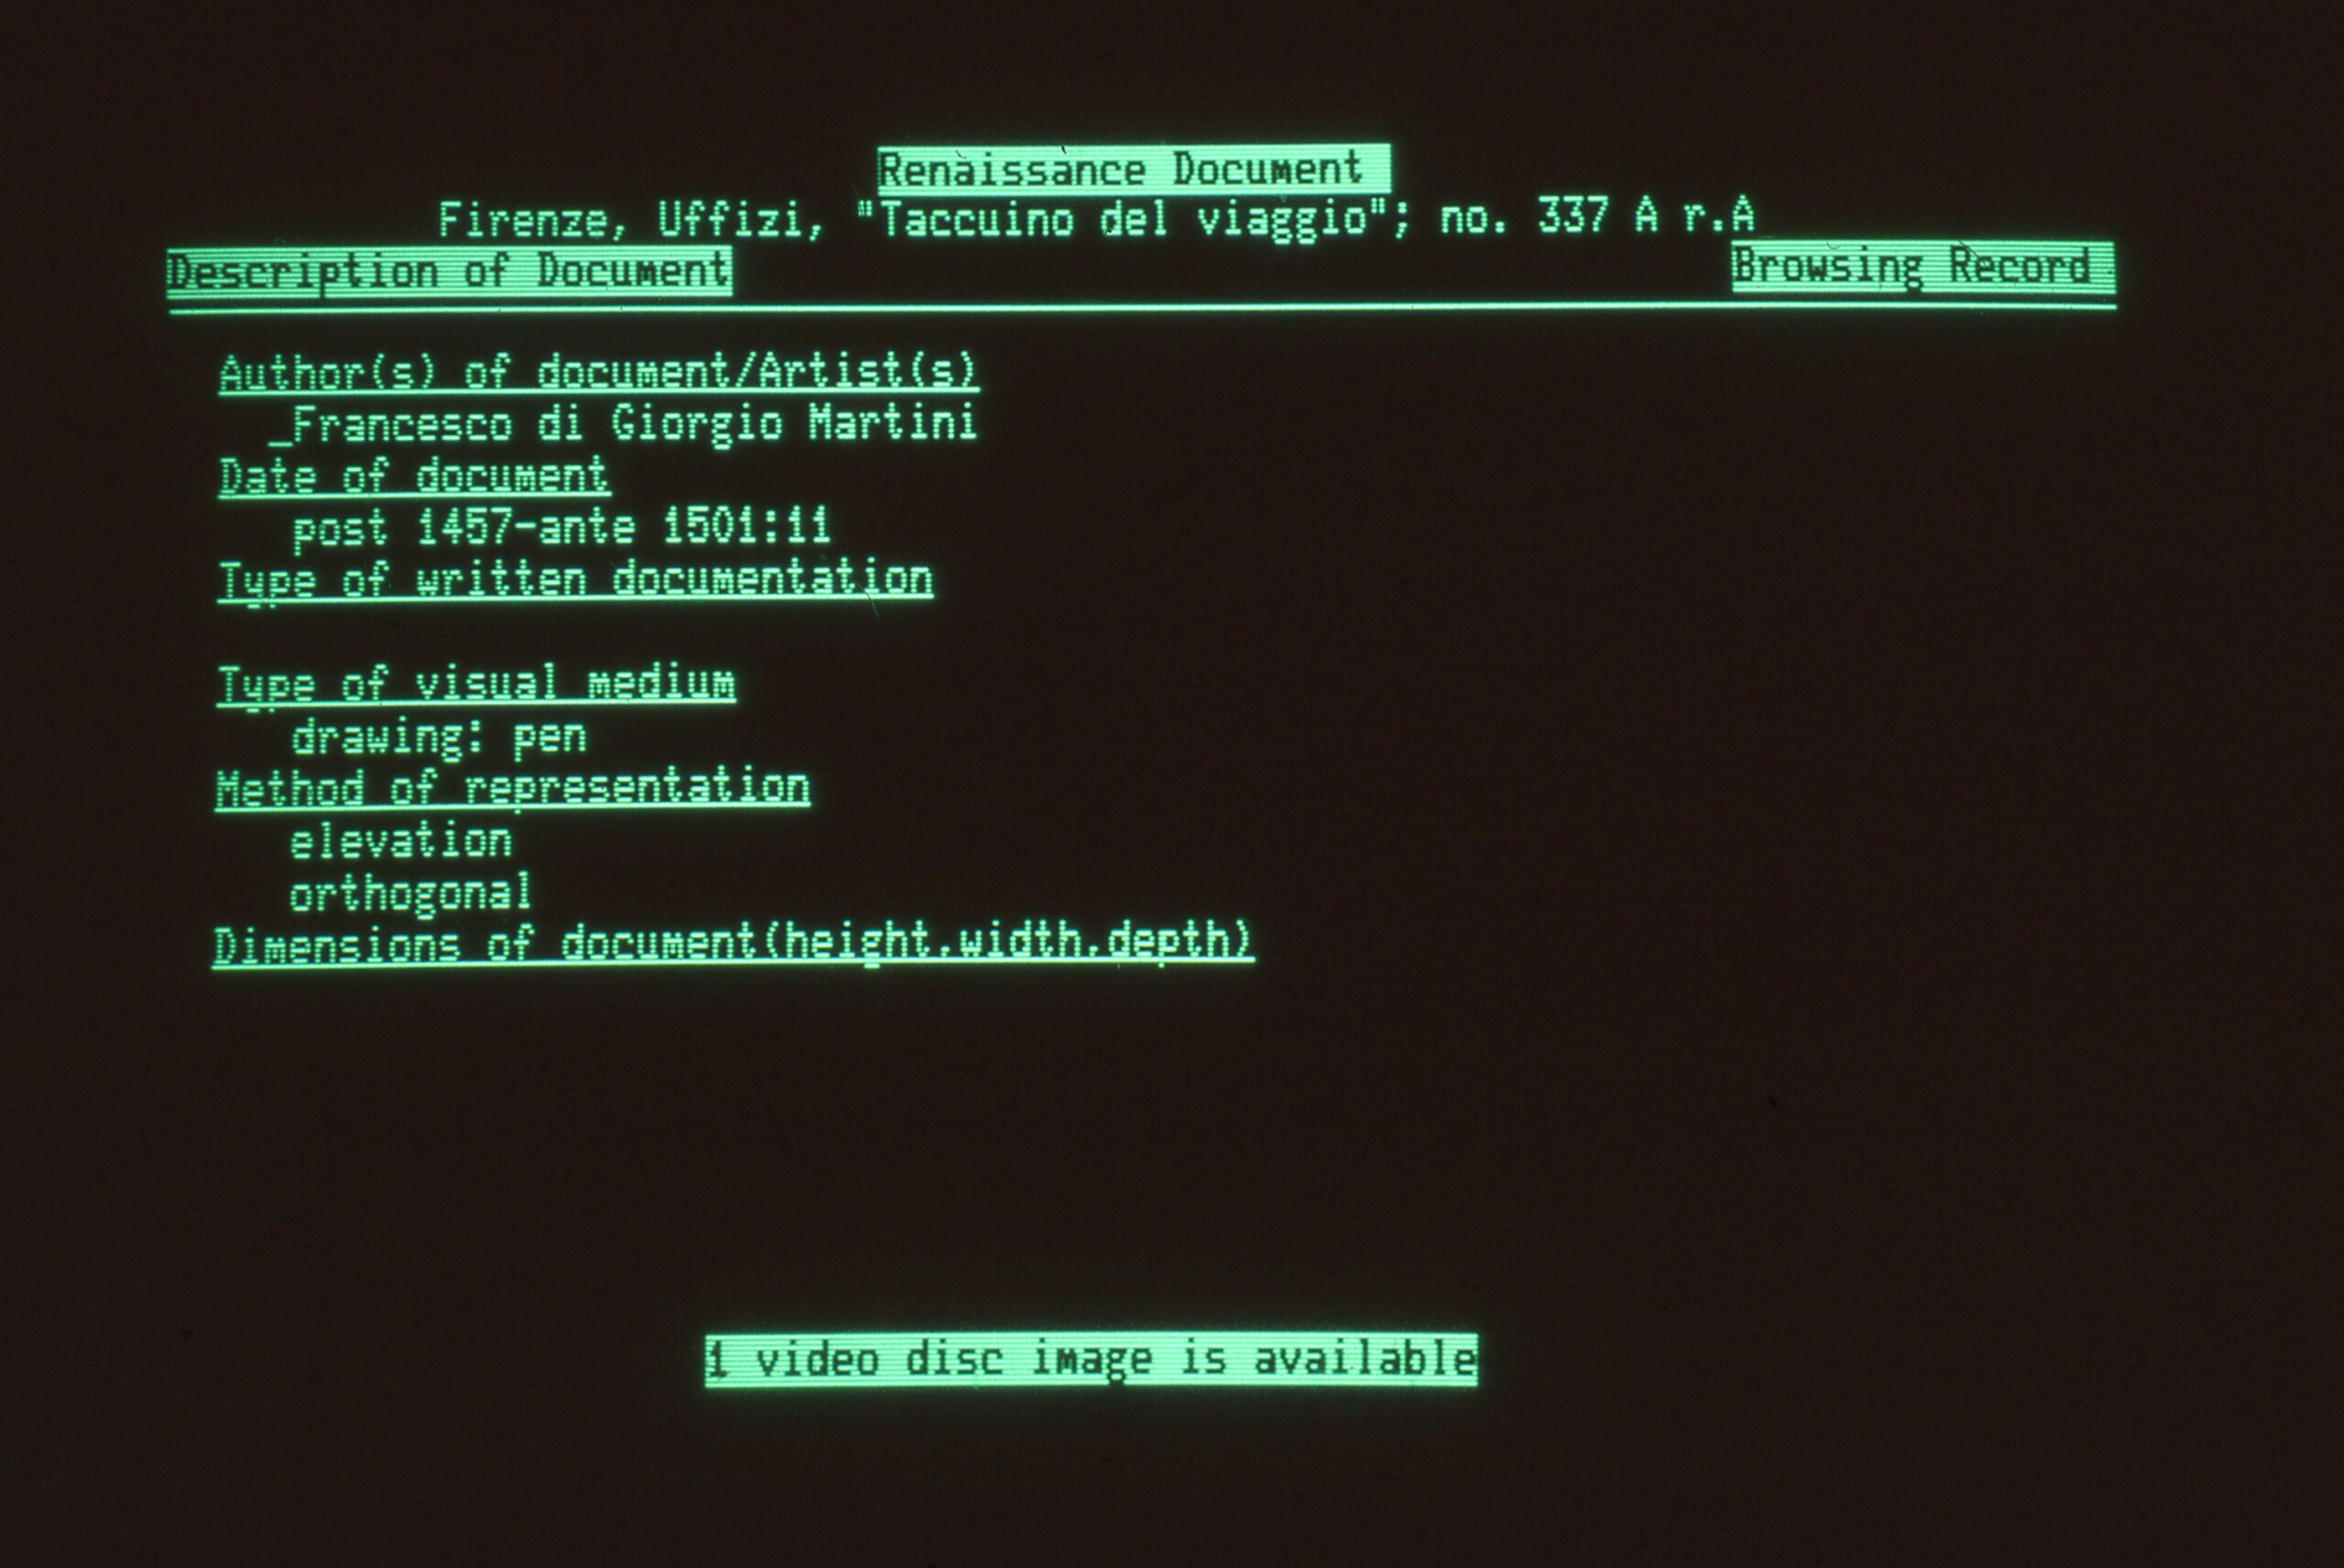
Census UNIX Retrieval System, Francesco di Giorgio, Uffizi, ‘Taccuino del viaggio’
The Data Model
The decision to digitise the index cards was made in the early 1980s. While the index card system had the disadvantage that the data could only be accessed by searching for the card of a particular ancient monument, the new data model, developed by Arnold Nesselrath with the programmer Rick Holt, created a number of searchable object types. This made it possible to search via the categories of ancient monuments, Renaissance documents, person, or location, amongst others. This is the data model the Census still uses today.
The Census today
The students in the Census seminar were interested in making the circa 10,000 ancient monuments and almost 50,000 Renaissance documents in the Census database more accessible for users. They created visualisations to enable visitors to the exhibition to easily access and interact with the immense Census database.
The categories of both ancient monuments and Renaissance documents are visualised in this diagram according to the total number of entries. Here one can easily see the full variety of almost 7,000 historical records, bibliographic references, people, styles and locations.
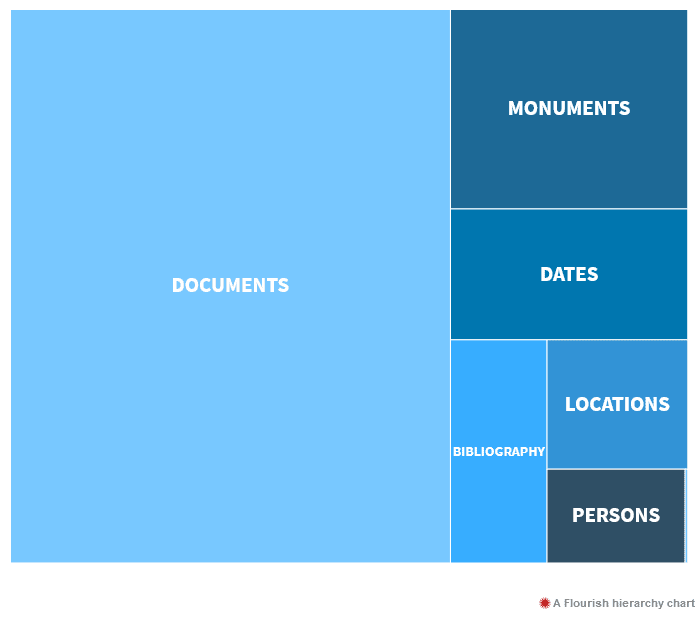
Visualisation of the Main Categories of the Database
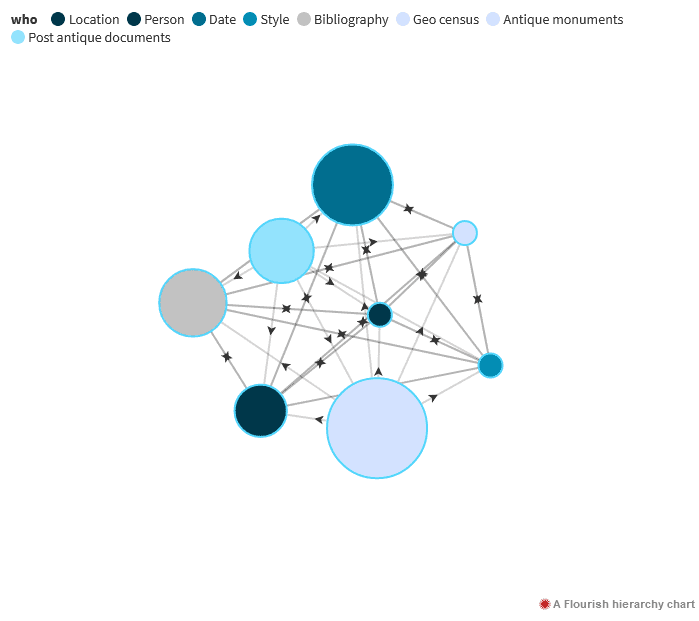
Relationships between the Most Important Object Types
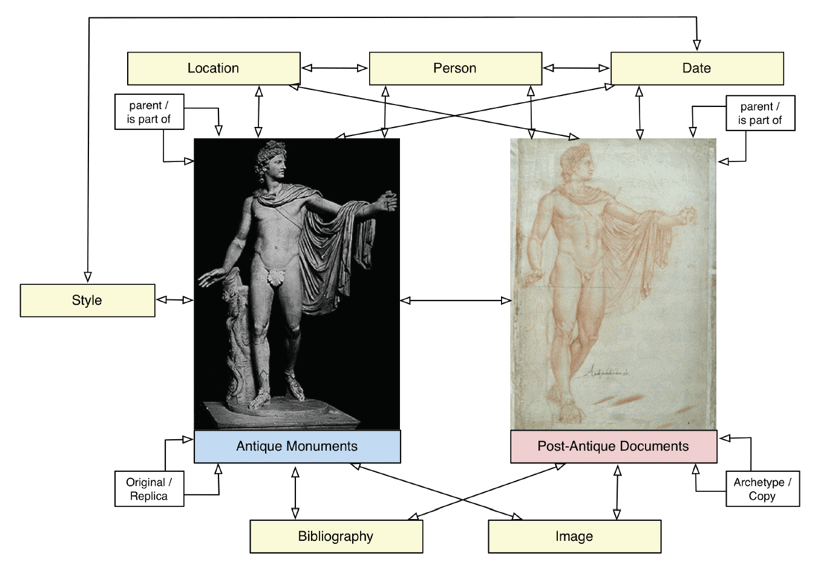
The Relationship and Links between the Main Categories
This visualisation offers an overview of how the authority files ‘Person’, ‘Date’, ‘Style’, ‘Location’, and ‘Bibliography’ relate to the primary files ‘Antique Monuments’ and ‘Renaissance Documents’. The size of the circles reflects the size of each category; the larger the circle, the more data is held in the Census. Given the variety of data and for the sake of clarity, subcategories were not included in this visualisation.
Visualisation of the Variety of Materials Represented in the Census
In order to clarify the variety of data in the Census, the different materials of the objects represented in the database is shown here in a diagram. If the material of an ancient monument is known, it is recorded in the database. Materials such as marble are described in specific categories that can be searched, e.g. ‘bigio africano’, ‘pavonazetto’ or ‘verde antico’. However, one can also display all monuments made of marble, whereby all subcategories appear in the search results.
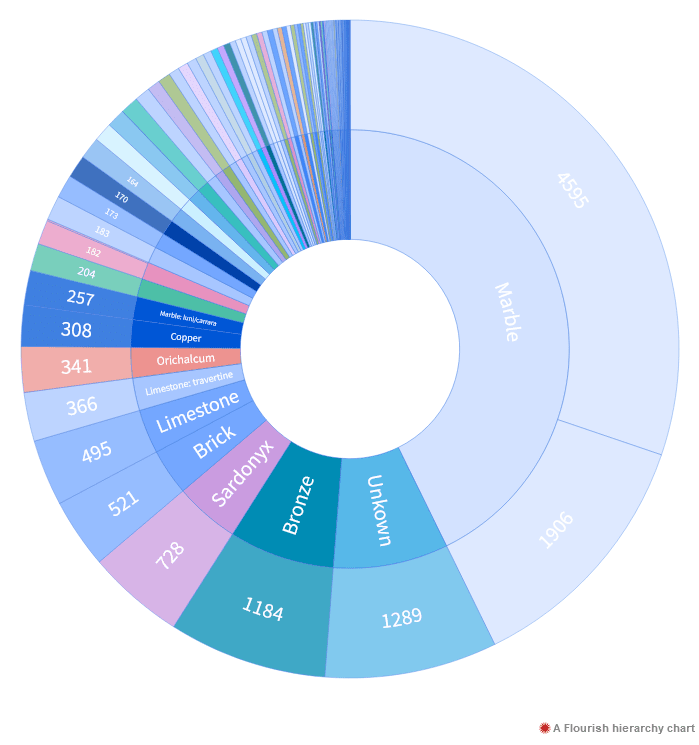
Pie Chart Showing the Materials of the Ancient Monuments Recorded in the Census Database
‘The Census Database’ (Room 4) is a collaborative exhibition by:
Agnete Bay
Tim Boroewitsch
Leonie Engel
Eva Karl
Matteo Anthony Kramer
Anna Latzko
Maria Elisabeth Lehmann
Sarah Letzel
Sophie Steiner